
1,120 Views
To be a successful trader, you need to understand technical analysis deeply. Technical analysis is the process of analysing price patterns and movements to identify trading opportunities. By studying charts and indicators, you can develop strategies that give you an edge in the market. This article will explore the basics of technical analysis and teach you how to use it to your advantage. You can also read more here.
What is technical analysis?
Technical analysis is a method of evaluating securities by analysing the statistical trends of market activity, such as past prices and trading volume.
Many technicians believe that the collective actions of all the participants in the market accurately reflect all relevant information and therefore, continually vote on the market’s direction with their transactions. Because of this belief, technical analysis is often used to identify price trends and make trading decisions.
Many techniques can be used in technical analysis, but some of the most popular include support and resistance levels, moving averages, and Fibonacci retracements.
While technical analysis can be applied to any security, it is most commonly used in commodities, forex, and equities trading.
How to get started with technical analysis
First, it is vital to select the right charting tools. There are various software programs and online resources available, so it is essential to choose ones that fit your individual needs.
Once you have selected your charting tools, you must become familiar with the most commonly used chart types and indicators. This familiarity will take some time and practice, but many resources are available to help you learn.
Once you understand how to read charts, you can start looking for patterns and making predictions about future price movements. Remember, there is no guarantee that your predictions will always be accurate, but technical analysis can give you an edge in the market.
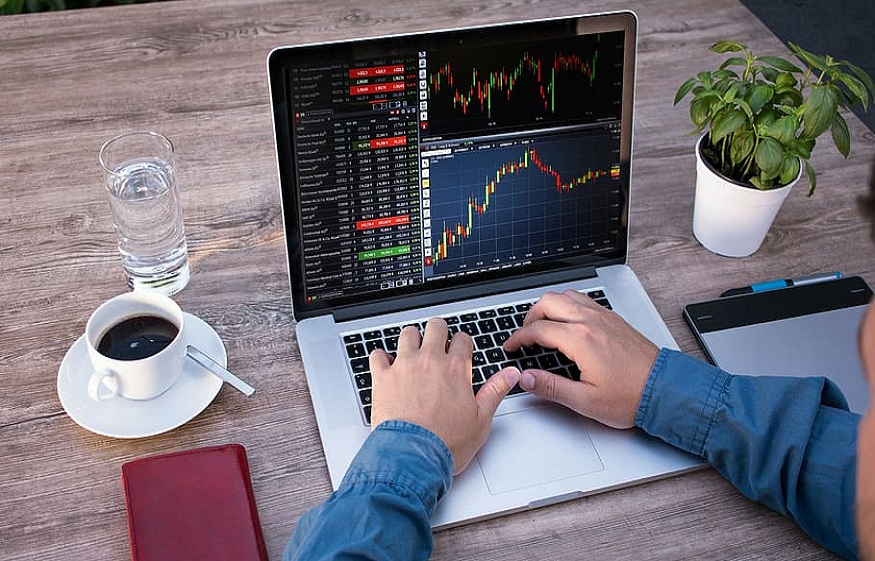
The different types of charts you can use for technical analysis
You can use a few different types of charts for technical analysis. The most common are line charts, bar charts, and candlestick charts.
- Line charts plot the price of a security over time.
- Bar charts plot the opening and closing prices, as well as the high and low prices, for a security over a given time.
- Candlestick charts are similar to bar charts, but they also give you information about the trading volume for each period.
- Technical analysts often use multiple charts to get a complete picture of where the price of a security is headed.
How to read charts and identify trends
When understanding data, charts and graphs can be beneficial.
You can quickly gain valuable insights into trends and patterns by taking a few moments to learn how to read them. For example, let’s say you’re looking at a line chart that tracks the monthly sales of a particular product. If you see that the sales have been steadily increasing over the past year, that’s a good sign that the product is popular and doing well. On the other hand, if the sales have been declining, it could be cause for concern. In either case, interpreting the data in a chart can give you a significant advantage in making decisions.
There are a few basic principles to keep in mind when reading charts.
First, take a look at the big picture. What is the overall trend? Is it rising, falling, or staying roughly the same? Next, pay attention to any sudden changes or spikes in the data. These could indicate that something important is happening that merits further investigation.
Finally, don’t forget to consider the context. For instance, if you’re looking at monthly sales figures, it might be helpful to know whether there was a seasonal promotion during that time.
The bottom line
Technical analysis is an influential tool traders can use to predict future movements in the market. Understanding and using critical technical indicators can make more informed investment decisions and increase your chances of earning consistent profits from trading.
While becoming a proficient technical analyst may take some time, the benefits are well worth the effort. Always use stop losses and risk management techniques to protect your capital while trading.